

What’s Being Retired, What Could Break in Your Reports, and How to Migrate
Power BI reports rarely break at a convenient time.
A report that has been working perfectly for years can suddenly become a maintenance problem when Microsoft changes a visual, updates a file format, or retires an older integration. And when an organization has hundreds of reports spread across different departments, identifying every affected report isn’t always easy.
That’s why Power BI changes in 2026 deserve attention from IT managers, BI leads, and report developers.
Some updates are designed to improve how teams build and manage reports. Others require businesses to review existing dependencies and plan a migration. The challenge is knowing which changes need immediate attention and which ones can be handled as part of regular Power BI maintenance.
In this guide, we’ll look at the important changes, their possible impact on existing reports, and a practical checklist IT teams can use to prepare.
1. Bing Maps to Azure Maps: Time to Review Your Existing Map Visuals
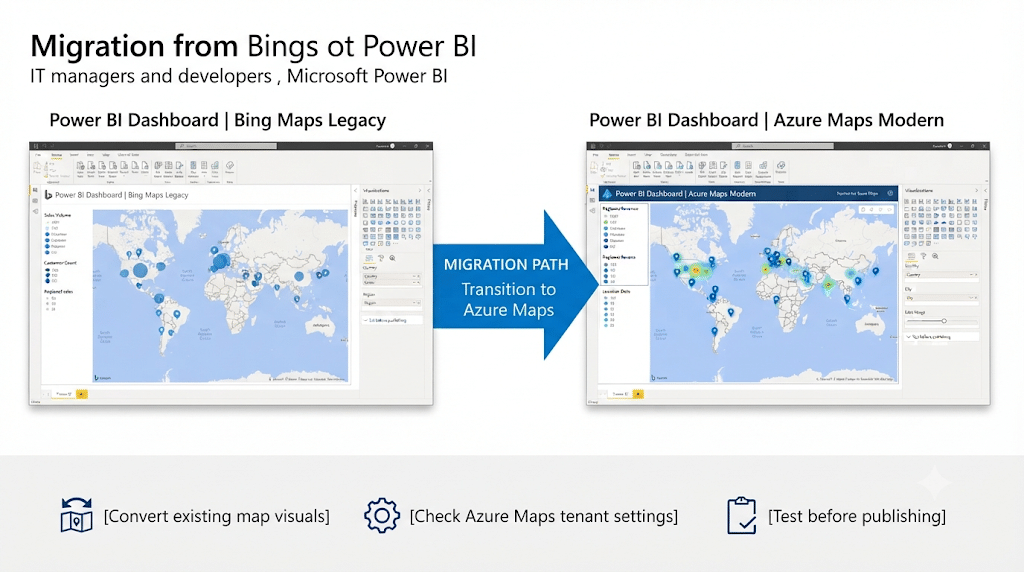
If your Power BI reports use maps to display sales territories, customer locations, delivery areas, or regional performance, this is one change worth checking.
Microsoft is moving Power BI users toward Azure Maps as the replacement for the older Map and Filled map visuals.
The important distinction is that Microsoft has announced the planned deprecation of the older Power BI Bing Maps visual, but it has not published a confirmed removal date for these visuals. Existing map visuals continue to work for now.
Microsoft has also announced the retirement of Bing Maps for Enterprise services, with enterprise customers able to continue using those services until June 30, 2028. This is a separate service timeline, so it shouldn’t be treated as the removal deadline for Power BI’s older map visuals.
What could happen to your reports?
The immediate concern isn’t necessarily that every map will stop working overnight. It’s that teams continue building new reports around a visual that Microsoft is moving away from.
When you eventually migrate, you may also notice differences in:
- Map appearance and formatting.
- Bubble and marker sizes.
- Location accuracy and geographic data.
- Layers, legends, and other visual settings.
- Access and availability across different regions.
These differences can affect how business users interpret information, especially when maps are used in operational or management reports.
For example, a telecom company might use a centralized telecom dashboard to monitor regional performance and operational activity. If map visuals are part of that reporting setup, changes to how locations are displayed need to be checked carefully.
How to migrate to Azure Maps
Microsoft provides a conversion option in Power BI Desktop to upgrade existing Map and Filled map visuals.
A basic migration process looks like this:
- Open the existing Power BI report in Power BI Desktop.
- Check whether the report contains Map or Filled map visuals.
- If the upgrade notification appears, select the option to upgrade maps.
- Alternatively, select an individual map visual and convert it through the Visualizations pane.
- Review the converted visual’s location fields, formatting, marker sizes, and other settings.
- Compare the new visual with the original report before publishing it.
One more thing to check: Azure Maps must be allowed through your organization’s Power BI tenant settings. Your administrator can review this under Admin Portal → Tenant settings → Azure Maps visual.
Also check regional support before migrating. Microsoft currently lists restrictions for certain locations, including China, Korea, and government cloud environments.
The conversion feature makes the process easier, but it doesn’t remove the need for testing. A map that looks slightly different can still affect how someone reads the report.
2. PBIR Is Becoming the Default Report Format
This is one of the more important changes for Power BI development teams in 2026.
If your team works with Power BI projects, Git integration, or automated report deployment, you’ve probably heard about PBIP and PBIR.
Microsoft has been moving Power BI toward a more developer-friendly way of storing report definitions. PBIR is a major part of that change.
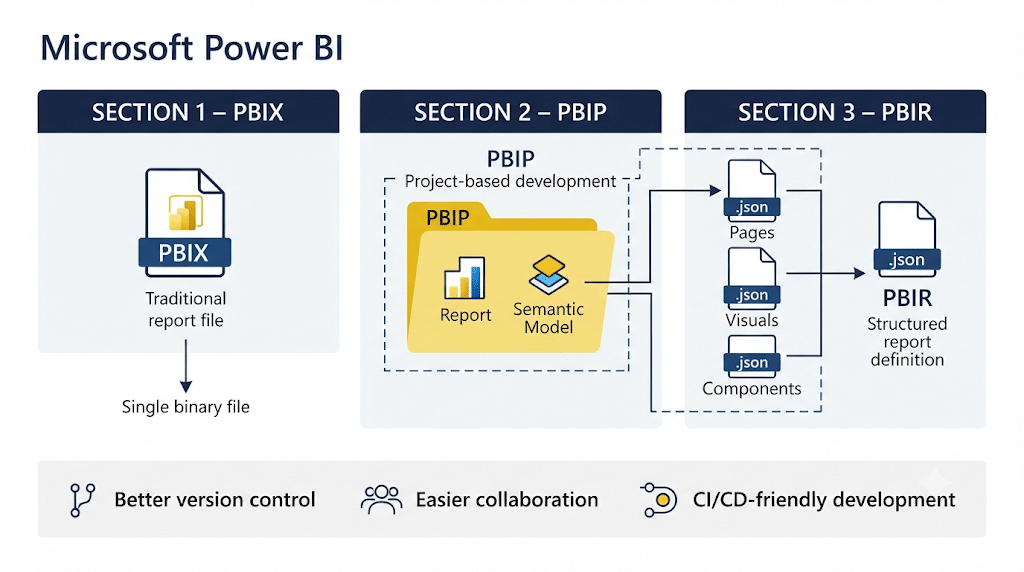
Previously, many teams worked with traditional PBIX files or the older PBIR-Legacy report definition. With PBIR, report components are stored as separate, structured JSON files.
For example, instead of keeping an entire report definition in one large file, PBIR organizes pages, visuals, bookmarks, and other report elements into individual files.
This makes it easier to track changes, compare versions, and work on reports collaboratively.
What’s changing in 2026?
Microsoft began rolling out PBIR as the default format in the Power BI service in January 2026, with full availability planned by the end of February. The March 2026 Power BI Desktop release also made PBIR the default format.
PBIR is now generally available.
Existing reports using PBIR-Legacy can still be opened. However, when you edit and save an older report, Power BI automatically converts it to PBIR.
Microsoft also creates a backup before conversion:
- Power BI Desktop retains the backup for 30 days.
- The Power BI service retains the backup for 28 days when conversion happens directly in the service.
This is useful, but development teams should still maintain their own version history and backups.
PBIX vs PBIP vs PBIR: What’s the difference?
These terms can be confusing because they’re related, but they don’t mean the same thing.
| Format | What it means | Best suited for |
|---|---|---|
| PBIX | Traditional Power BI Desktop file containing report and model content | Individual report development and sharing |
| PBIP | Power BI Project format that stores a report and semantic model in a folder structure | Team development, source control, and deployment workflows |
| PBIR | Enhanced report definition format used within a Power BI project | Managing report elements as separate files |
Think of PBIP as the overall project structure and PBIR as the format used to store the report definition within that project.
Who needs to pay attention?
This change is particularly relevant to:
- Power BI developers working with Git.
- Teams using Microsoft Fabric Git integration.
- Organizations managing multiple report versions.
- Developers using scripts to update report definitions.
- Teams building automated deployment processes.
For teams that mainly open and publish PBIX files, the day-to-day experience may not change dramatically.
However, development teams should understand the new structure before introducing external editing or automation.
Migration recommendation: Don’t convert every report and immediately introduce automated changes. Start with a development report, test the conversion, review the resulting files, and establish a version-control process before expanding it across production reports.
3. Power BI Report Server: Excel Workbook Hosting Has Reached Its Deadline
Organizations running Power BI Report Server on-premises should pay particular attention to this change.
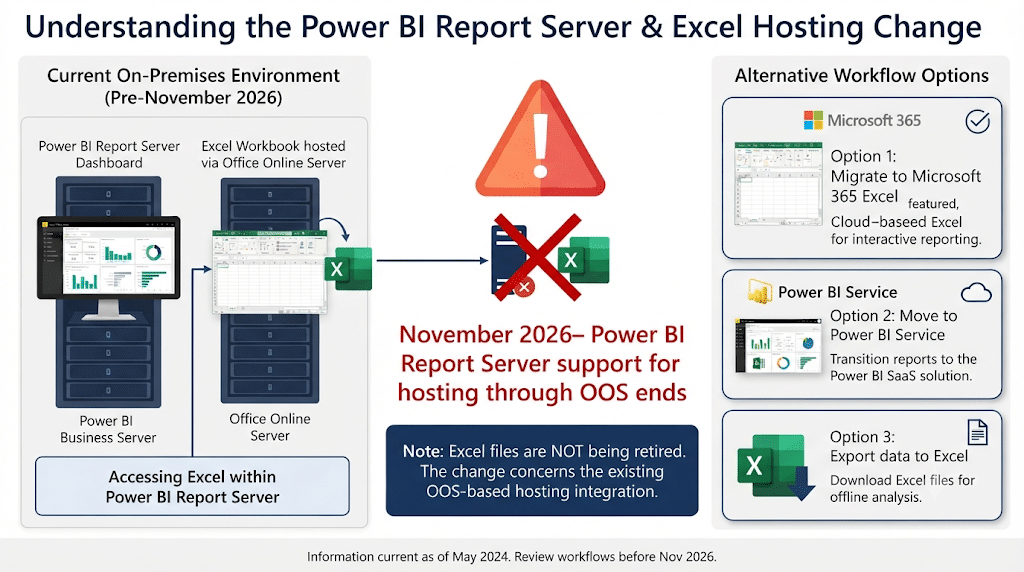
Some businesses use Power BI Report Server not only for Power BI reports but also to host and view Excel workbooks through Office Online Server (OOS).
Microsoft has announced the end of this integration.
According to Microsoft’s documentation:
- Configuration support ended with the January 2026 Power BI Report Server release.
- Power BI Report Server ended support for hosting Excel workbooks through OOS in November 2026.
- Office Online Server itself is scheduled for retirement on December 31, 2026.
Since November 2026 is already here, organizations still depending on this setup should review their arrangements immediately.
What does this mean for your business?
If employees access Excel workbooks through the Power BI Report Server web portal, that workflow needs attention.
The change doesn’t mean that Excel files themselves disappear. It means the existing OOS-based hosting and viewing arrangement is no longer supported through Power BI Report Server.
What should IT teams do?
Start by identifying:
- Which departments use Excel workbooks hosted through Power BI Report Server.
- Whether those workbooks are still part of daily business operations.
- Which teams need browser-based access.
- Whether the workbooks have external data dependencies.
- What alternative access method will work for each department.
Microsoft identifies Microsoft 365 Excel, the Power BI service, and exporting data to Excel as possible alternatives.
The right choice depends on how employees use these workbooks and whether the organization plans to retain its on-premises reporting environment.
4. Other Power BI Changes IT Teams Should Monitor
Not every Power BI change in 2026 involves a complete retirement.
Some updates affect how developers work with reports, semantic models, and AI features. Others introduce new ways to manage data and automate development.
Rather than treating every new feature announcement as a breaking change, IT teams should separate three things:
- Deprecations: Features Microsoft plans to retire or stop supporting.
- Default changes: Existing workflows may behave differently as Microsoft changes the standard experience.
- New capabilities: Features that may require development teams to update their processes.
Here are some areas worth monitoring.
Copilot and DAX development
Copilot can help Power BI developers generate, explain, and work with DAX queries.
This can reduce some of the manual effort involved in writing and understanding calculations. However, developers should not assume every generated query is correct.
Review the generated DAX, check the results against known business figures, and test its performance before applying it to a production model.
If you’re interested in how AI is changing Power BI beyond DAX generation, this overview of AI in Power BI explores some of the wider changes businesses should understand.
Dataflows Gen2 and data export workflows
Teams using Dataflows Gen2 should review Microsoft’s current documentation and release notes for changes to export capabilities and supported workflows.
If a dataflow feeds several reports or downstream processes, check those dependencies before changing how data is exported or consumed.
ARM and infrastructure management
Teams managing Power BI and Fabric resources through automation should keep an eye on changes to deployment and infrastructure management capabilities, including ARM-related support.
The important question is whether existing scripts, deployment processes, and resource-management workflows still match Microsoft’s supported approach.
Metric Sets and other feature announcements
If your organization uses Metrics or other specialized Power BI capabilities, review Microsoft’s latest deprecation announcements rather than assuming an older feature will continue to receive support.
The Power BI monthly update archive and Microsoft Fabric documentation are useful places to monitor these changes.
A practical tip: Maintain a simple internal change log with the feature name, announcement date, affected reports, expected deadline, and assigned owner. This makes it easier to turn Microsoft’s monthly announcements into actual maintenance tasks.
5. Copilot Readiness: Your Reports Need More Than an AI Feature
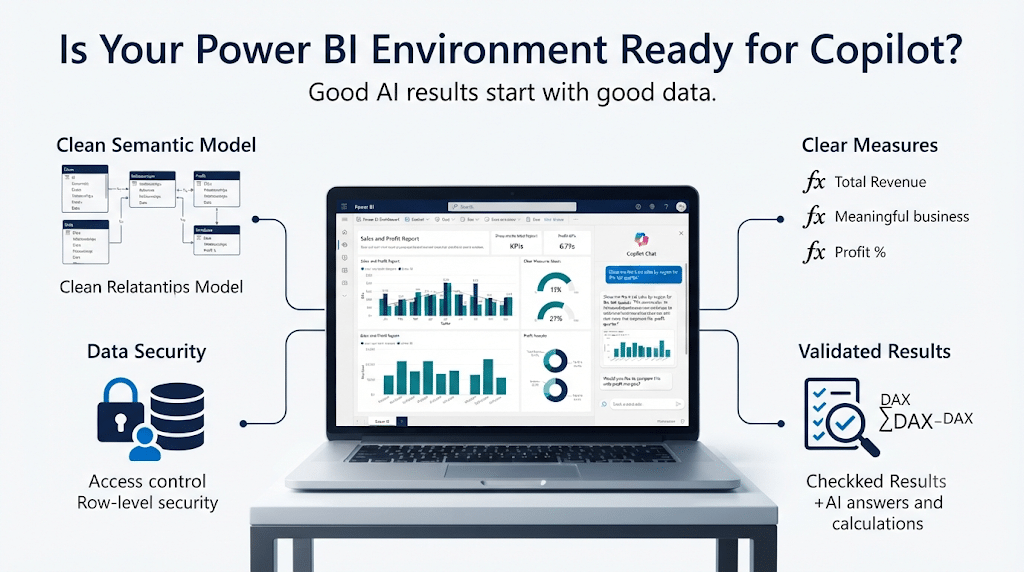
Another important part of Power BI’s development is the growing role of Copilot.
Many organizations are interested in using AI to explore business data, generate DAX queries, summarize reports, and make analysis easier for non-technical users.
But enabling Copilot doesn’t automatically make an existing Power BI environment ready for AI.
The quality of the output depends heavily on the quality of the underlying semantic model.
Imagine asking Copilot:
“Which product category generated the highest profit last quarter?”
If the model contains unclear measure names, duplicated calculations, inconsistent date fields, or poorly defined relationships, the response may not reflect the business question accurately.
That’s why preparing your semantic models is an important step.
What should you review before introducing Copilot?
1. Clear table and column names
Use names that describe the actual business meaning of the data. Avoid confusing abbreviations and unnecessary technical labels.
2. Meaningful measure descriptions
A measure called Total Revenue is more understandable than something like Measure_14.
Adding descriptions that explain how a measure is calculated and what it represents gives users and AI tools better context.
3. A well-structured semantic model
Review relationships, calculation logic, date tables, and duplicated fields. Make sure the model reflects how the business actually understands its data.
4. Security and governance
Check row-level security, workspace permissions, tenant settings, and data access policies. AI features should operate within the organization’s intended security boundaries.
5. Validate AI-generated results
Copilot can assist with analysis, but important business decisions should still involve human review. Check calculations and compare results with trusted reports.
Preparing for Copilot is therefore not just an AI implementation task. It’s also an opportunity to improve the overall quality of your Power BI environment.
6. Which Changes Should Your IT Team Prioritize?
Not every update needs the same level of attention. Some changes affect existing reports directly, while others mainly affect development workflows.
Here’s a practical way to prioritize them.
| Change | Who is affected? | Priority | Suggested action |
|---|---|---|---|
| Legacy Map visuals | Teams using Map and Filled map visuals | High | Identify and test Azure Maps conversion |
| PBIR default format | Power BI developers and Git-based teams | Medium | Test report conversion and update workflows |
| Report Server Excel hosting through OOS | On-premises Report Server users | Critical if still in use | Review and replace the existing workflow |
| Copilot readiness | Teams introducing AI-powered reporting | Medium | Improve semantic models and governance |
| Other feature deprecations | Teams using affected features | Depends on usage | Review Microsoft’s current announcements |
These priorities are practical recommendations, not official Microsoft severity ratings. Your actual urgency depends on how heavily your organization relies on each feature.
7. Power BI Migration Checklist for IT Teams
Before making changes to production reports, it’s worth carrying out a basic Power BI environment audit.
The following checklist can help IT managers, BI leads, and report developers organize the work.
Report inventory
- List all active Power BI reports across workspaces.
- Identify reports using Map and Filled map visuals.
- Identify reports using older or unsupported features.
- Find reports that are no longer maintained but are still being accessed.
- Assign an owner to each critical report.
PBIR and development workflows
- Identify reports using PBIX, PBIP, and PBIR.
- Review how existing PBIR-Legacy reports will be converted.
- Check whether Git integration is used.
- Test PBIR-based workflows in a development environment.
- Maintain version history and backups before making bulk changes.
Power BI Report Server
- Identify any Excel workbooks hosted through Office Online Server.
- Check which departments still depend on them.
- Review alternative access options.
- Communicate any workflow changes to affected users.
Copilot and semantic model readiness
- Review table and column naming conventions.
- Add descriptions to important measures.
- Check relationships and calculation logic.
- Review row-level security and workspace permissions.
- Validate AI-generated DAX and analytical results.
Migration and testing
- Back up critical reports and semantic models.
- Test changes in a development workspace.
- Compare migrated visuals with their original versions.
- Check filters, slicers, bookmarks, and drill-through functionality.
- Validate report performance and data accuracy.
- Assign migration owners and completion dates.
A report migration should not be considered complete simply because the report opens successfully. It should also produce the same expected business results.
8. Common Power BI Migration Mistakes to Avoid
Even when the technical changes appear straightforward, migration projects can create problems if teams rush through them.
Here are some mistakes worth avoiding.
Waiting until Microsoft removes a feature
If Microsoft has already announced a deprecation, waiting until the final deadline creates unnecessary pressure.
Start by identifying affected reports and planning the transition while the existing functionality is still available.
Assuming converted visuals will look exactly the same
The Azure Maps conversion process carries over existing settings, but visual differences can still occur.
Check marker sizes, geographic locations, formatting, and other details before publishing the updated report.
Ignoring reports that nobody seems to own
Some of the most difficult reports to migrate are older reports that were created for a specific department or employee.
They may still support important business activities even if the original developer has left the organization.
Identify report owners and business users before making changes.
Making changes directly in production
Bulk conversions and format changes should not be the first step.
Use a development workspace, maintain backups, test the updated reports, and publish only after validation.
Treating AI readiness as simply enabling Copilot
An AI feature cannot fix a poorly structured semantic model by itself.
Review the data, calculations, descriptions, and security settings before introducing AI-powered reporting into everyday business workflows.
9. When Should You Get Help With Your Power BI Environment?
Power BI maintenance can become difficult when an organization has multiple reports, complex semantic models, different data sources, and limited internal development resources.
A small visual migration may be manageable internally. But when changes affect several departments, shared datasets, automated deployments, and business-critical dashboards, the work can require a more structured approach.
This is where working with an experienced Power BI service provider can be useful.
For example, businesses planning to improve their inventory, sales, and customer reporting may also need to review how their existing dashboards are structured. A well-organized Power BI dashboard can help bring information together, but it needs reliable data models and ongoing maintenance behind it.
For businesses that don’t want to expand their permanent BI development team for every migration or reporting requirement, an offshore Power BI service provider such as SparkSupport can offer an additional source of technical support.
The right development partner should understand more than report creation. Experience with DAX, data modeling, Power Query, performance tuning, and report deployment can make a difference when reviewing an existing Power BI environment.
If you’re evaluating the technical capabilities needed for this kind of work, this guide to Power BI developer skills can help you understand what to look for.
The engagement model is another consideration. Some organizations need ongoing development support, while others only need help with a specific migration or reporting project. Understanding Power BI outsourcing can help businesses decide which arrangement makes sense.
Cost can also influence that decision. If you’re comparing internal hiring with external support, the Power BI developer rates guide offers a useful starting point for understanding how rates vary across countries.
The important thing is to understand the current environment first. A report audit can help identify what needs attention, what can remain as it is, and which changes should be prioritized.
If your team needs help reviewing its existing reports, planning a migration, or improving its reporting environment, you can explore SparkSupport’s Power BI consulting to understand the available support.
The goal isn’t to rebuild every report just because Microsoft has introduced a new format or feature. It’s to make sure your reporting environment remains reliable, maintainable, and ready for future changes.
Frequently Asked Questions
Is Bing Maps being removed from Power BI in 2026?
Microsoft has announced the planned deprecation of the older Bing Maps-based Map and Filled map visuals in Power BI. However, Microsoft has not confirmed a specific removal date for these visuals. Existing visuals remain available for now, and users are encouraged to migrate to Azure Maps.
Do I need to convert all my PBIX files to PBIP?
No. PBIX files can still be used for traditional Power BI development. PBIP is particularly useful for teams that need source control, collaborative development, and automated deployment workflows. PBIR is the enhanced report definition format used within Power BI projects.
Will existing Power BI reports stop working because of PBIR?
No. Existing PBIR-Legacy reports can still be opened. When you edit and save them, Power BI automatically converts them to PBIR. However, development teams should test their workflows and maintain version history.
What happens to Excel workbooks hosted in Power BI Report Server?
Power BI Report Server ended support for hosting Excel workbooks through Office Online Server in November 2026. Organizations still using this integration should review alternatives such as Microsoft 365 Excel or the Power BI service.
How can I prepare my Power BI reports for Copilot?
Start by improving your semantic models. Use clear names, add meaningful measure descriptions, review relationships and calculations, and check security settings. Always validate Copilot-generated queries and results before relying on them for business decisions.
Final Thoughts
Power BI changes in 2026 are not just about new features or updated report formats. They also highlight the importance of maintaining an environment that can adapt as Microsoft’s platform evolves.
For IT teams, the best approach is to know what is currently in use, identify dependencies, and plan migrations before they become urgent.
Start with your report inventory. Check the visuals and integrations your organization relies on. Test the changes in a development environment, and make sure business users are not affected by the transition.
A little preparation now can save your team from a much bigger reporting problem later.