Introduction
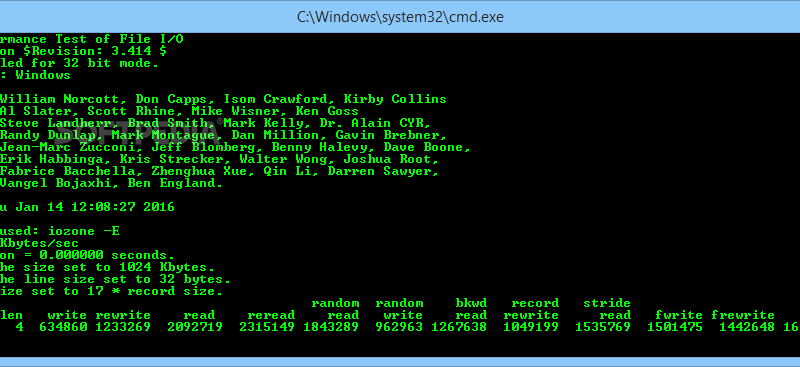
Iozone is an open source file system benchmarking tool which lets you to evaluate various aspects of a filesystem performance like read, write, rewrite, random read etc. It is ported to various platforms and can be run on all major operating systems like Linux, Microsoft Windows Mac OS X. Though it can be used for the detailed analysis of the filesytem IO performances, here we describe in short how to install it in Linux and get the analysis plotted to a graph.
How to install
1. Download the rpm source fro the Iozone benchmarking tool from the following link or enter the follwing command at the command prompt
[bash]wget http://www.iozone.org/src/current/iozone-3-338.i386.rpm[/bash]
2. install Iozone using the following command
[bash]rpm -ivh /path/to/iozone-3-338.i386.rpm[/bash]
Now the filesystem benchmarking tool is installed. To verify the installation you can find the files of Iozone tool in the directory /opt/iozone/
Plotting a graph from Iozone analysis
For the plotting of a graph you should ensure that gnuplot is already installed in your machine. Gnuplot is a command-driven opensource function plotting tool. If it isn’t installed you may install it using the following command
[bash]yum install gnuplot[/bash]
After ensuring that you have got gnuplot installed. Lets try plotting the analysis of the Iozone tool on a graph. Here we will analyze the filesystem with in auto mode. Run th iozone command and redirect its output to a file.
[bash]/opt/iozone/bin/iozone -a -g 4m > /tmp/test_analysis[/bash]
In the above command we have set the maximum size of a file for auto mode to 4mb with -g option. For brief study about Iozone commands use
[bash]/opt/iozone/bin/iozone -h[/bash]
To generate the graph there is another command which is installed with the iozone tool ie Generate_Graphs. To plot the graph use the following commands
[bash]/opt/iozone/bin/Generate_Graphs /tmp/test_analysis[/bash]
A new window will pop up with the plotted graph of the write performance. At the command line if you hit enter then new graph is plotted fro the rewrite performance. Thus there will be graph plotted for many IO performances as you hit enter each time. Evaluate the required IO performances from the set of graphs depending on the application that you are planning to deploy.
Have a nice day 🙂


