How to Fix Slow Elasticsearch Queries in Spring Boot

How to Fix Slow Elasticsearch Queries in Spring Boot (5 Seconds to Under 500ms)

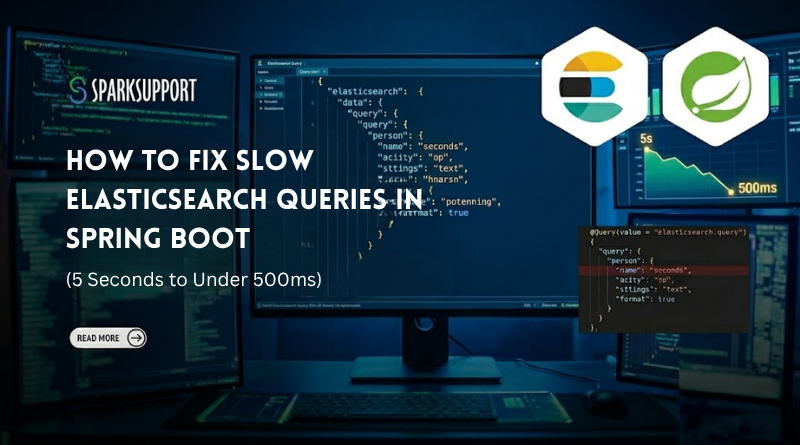
Elasticsearch running slow on millions of records? Here’s the exact query-level fix our Java engineers applied to achieve a 90% performance improvement in a live Spring Boot production system.

Why Elasticsearch Searches Are So Slow (And How We Fixed It)

At Sparksupport, our Java development team regularly works on high-volume enterprise systems built with Spring Boot and Elasticsearch. On one such production project, we were dealing with over 5 million records — and search queries were consistently taking 3 to 5 seconds to respond.

For any production application, that kind of latency is unacceptable. Users felt it, stakeholders flagged it, and the engineering team needed answers fast.

After systematic debugging and testing, we brought the response time down to under 500 milliseconds — a 90% improvement — without changing the infrastructure, adding hardware, or re-architecting the data model.

This blog breaks down the exact mistakes we found and the specific fixes that made all the difference. If your Elasticsearch performance is suffering, the root cause is almost certainly in how the queries are written — not in the volume of data.

💡 Quick Takeaway
Elasticsearch performance problems on large datasets are almost always a query design problem, not a hardware or data volume problem. The fixes are simpler than you think.

The Setup: 5 Million Records, Simple Queries, Terrible Performance

The system was straightforward. Users searched across a dataset of 5+ million event records using basic filters:

  • eventId — an exact identifier
  • status — a fixed enum value like ACTIVE or INACTIVE
  • timestamp — a date/time field for range filtering

No complex full-text search. No fuzzy matching. Just structured lookups on known fields.

Despite this, every query was painfully slow. The problem wasn’t the data — it was how Elasticsearch was being asked to process it. Three anti-patterns were compounding on each other to produce terrible performance at scale.

Elasticsearch Anti-Patterns That Kill Performance at Scale

Anti-Pattern 1: Using match for Exact-Value Fields

The team was using match queries for fields like eventId — a natural-looking choice, but the wrong one for this use case:

{
"query": {
"match": {
"eventId": "12345"
}
}
}

The match query is designed for full-text search. It runs the input through a text analyser before searching — tokenising it, lowercasing it, and applying filters. For a field like eventId, which is a plain identifier, that entire analysis pipeline runs unnecessarily on every single query.

At 5 million records, even this small overhead multiplies into seconds of wasted processing time.

❌ The Problem match triggers text analysis on every query — completely unnecessary for IDs, status fields, or enums. It adds overhead and can return unexpected results.

Anti-Pattern 2: Using must When Scoring Isn’t Needed

Boolean must was the default choice for all filter conditions:

{
"query": {
"bool": {
"must": [
{ "term": { "status": "ACTIVE" } }
]
}
}
}

The must clause does two things: it filters results AND calculates a relevance score for every matching document. When your only goal is to retrieve records where status = ACTIVE, relevance scoring is completely pointless — but Elasticsearch still calculates it for every single document in the result set.

On millions of records, this adds up fast. The scoring overhead was silently inflating every query’s execution time.

❌ The Problem must calculates relevance scores even when you don’t need them. On large datasets, this is pure wasted computation.

Anti-Pattern 3: Deep Pagination with from and size

Standard pagination was implemented using from and size:

{
"from": 10000,
"size": 10
}

This is one of the most dangerous Elasticsearch patterns on large datasets. To return page 1001 with 10 results per page, Elasticsearch doesn’t just fetch 10 records — it fetches and sorts all 10,010 records across all shards, then discards the first 10,000.

As page numbers climb, so does the work. By page 500, Elasticsearch is scanning and sorting 5 million records just to return 10. This is known as the deep pagination problem, and it’s a well-documented Elasticsearch performance killer.

❌ The Problem from + size forces Elasticsearch to fetch and sort every skipped record. At deep pages and high volumes, this becomes catastrophically slow.

Fixes That Brought Elasticsearch from 5s Down to Under 500ms

Fix 1: Switch from match to term with .keyword

For all exact-value fields — IDs, status codes, enums — we replaced match with term queries on the .keyword sub-field:

{
"query": {
"term": {
"eventId.keyword": "12345"
}
}
}

The term query skips the analysis pipeline entirely and performs a direct lookup in Elasticsearch’s inverted index. It’s fast, precise, and exactly right for any field where you need an exact match. The .keyword sub-field ensures the value is matched as stored, with no tokenisation applied.

✅ The Fix Use term queries for IDs, enums, and status fields. Always target the .keyword sub-field for string exact matches. This alone eliminated seconds from query time.

Fix 2: Replace must with filter

Everywhere we were filtering (not ranking), we switched from must to filter:

{
"query": {
"bool": {
"filter": [
{ "term": { "status": "ACTIVE" } }
]
}
}
}

The filter clause does one thing: it checks whether a document matches the condition. It does not calculate any relevance score. That’s a significant reduction in work per document.

Even better, Elasticsearch can cache filter results at the segment level. When the same filter runs multiple times (e.g., status = ACTIVE is a very common query), the cached result is reused, making repeated queries near-instant.

✅ The Fix Always use filter instead of must when relevance ranking is not required. It skips scoring, enables caching, and dramatically reduces query overhead.

Fix 3: Replace Deep Pagination with search_after

We replaced the from / size pagination pattern with Elasticsearch’s search_after API:

{
"size": 10,
"search_after": [12345],
"sort": [
{ "eventId": "asc" }
]
}

Instead of skipping records by offset, search_after continues from the last document’s sort value. Elasticsearch doesn’t have to scan or discard any records — it jumps directly to the correct position in the index.

The performance difference at scale is dramatic. Whether you’re on page 2 or page 2,000, the query cost remains constant. This is the recommended approach for any paginated access across large datasets.

✅ The Fix Use search_after for paginating large datasets. It maintains constant query cost regardless of how deep into the dataset you go.

Fix 4: Define Correct Field Mappings Upfront

One of the most impactful (and most overlooked) performance factors is index mapping. We explicitly mapped eventId as a keyword type instead of relying on Elasticsearch’s dynamic mapping:

{
"mappings": {
"properties": {
"eventId": { "type": "keyword" },
"description": { "type": "text" }
}
}
}

When Elasticsearch auto-detects a string field, it often creates both text and keyword sub-fields — but doesn’t always get it right for all fields. By explicitly mapping eventId as keyword, we ensured:

  • Values are stored as-is, with no analysis
  • The field is optimised for exact-match lookups
  • Storage overhead is reduced
  • Indexing speed improves

Fields genuinely requiring full-text search (like description) remain as text. The key is being intentional about which type each field needs.

✅ The Fix Always define your index mappings explicitly. Correct field types are the foundation of good Elasticsearch performance — and the cheapest optimization to make.

The Optimized Spring Boot Implementation

Here is what the fully optimized query looks like using the Elasticsearch Java client in a Spring Boot service. This single method incorporates all four fixes — term queries, filter clauses, search_after pagination, and correct field targeting:

public SearchResponse<Product> searchActiveEvents(String eventId) throws IOException {
return elasticsearchClient.search(s -> s
.index("events_index")
.query(q -> q
.bool(b -> b
// Fix #1 & #2: filter (not must) + term (not match)
.filter(f -> f.term(t -> t.field("status").value("ACTIVE")))
.filter(f -> f.term(t -> t.field("eventId.keyword").value(eventId)))
)
)
// Fix #3: Keyset pagination — no deep offset scanning
.size(10)
.sort(so -> so.field(f -> f.field("timestamp").order(SortOrder.Desc))),
Product.class
);
}

Before vs. After: The Performance Impact

Performance Table
ScenarioResponse TimeStatus
Before Optimization (5M+ records)3 – 5 seconds
Too Slow
After Optimization< 500 ms
Production Ready

The improvement wasn’t the result of scaling infrastructure, reindexing data, or adding caching layers. It came entirely from writing queries correctly. The data hadn’t changed. The cluster hadn’t changed. Only the query logic changed — and the impact was immediate and significant.

Key Takeaways: Elasticsearch Performance Best Practices

These are the principles that should guide any Elasticsearch implementation handling large datasets:

  1. Use term queries for exact values. Any field holding an ID, status code, enum, or identifier should use term with .keyword — never match.
  2. Use filter instead of must for conditional logic. When you’re filtering records rather than ranking them, filter is always the right choice. It skips scoring, enables caching, and reduces per-document work.
  3. Never use deep from/size pagination on large indices. Replace it with search_after for consistent, scalable pagination performance regardless of dataset size.
  4. Define your mappings explicitly. Do not rely on Elasticsearch’s dynamic mapping. Correct field types are the cheapest and most foundational performance optimisation available.
  5. Test with production-scale data. Elasticsearch query performance characteristics don’t always surface at small data volumes. Always performance-test with realistic record counts.

Need Help Optimising Your Java or Elasticsearch System?

The patterns described in this post are ones our team applies regularly across client engagements. Whether it’s tuning an underperforming search layer, refactoring a slow Spring Boot service, or designing a scalable data architecture from the ground up, Sparksupport’s engineering team has deep hands-on experience delivering results.

Explore what we do:

Have a performance problem in your Java or Elasticsearch stack? Get in touch with our team — we’d be glad to take a look.

External References & Further Reading

For developers looking to go deeper on any of these topics, the following official Elasticsearch documentation pages are the authoritative source:

About Sparksupport

Sparksupport is a technology partner helping businesses build, scale, and optimise software systems. Our engineering teams specialise in Java, Spring Boot, cloud architecture, and enterprise-grade application development. We publish practical engineering insights from real project experience — no filler, no theory, just what actually works in production.

Explore Our Pages

sparksupport.com  •  Contact Us  •  Engineering Blog  •  Case Studies

Leave a Reply

Your email address will not be published. Required fields are marked *